Zimbabwe Biodiversity, Climate Change and Resilience
Biodiversity Significance
Protected Area Footprint
Threats to Biodiversity
Resilience
Mainstreaming


Biodiversity significance layers

Statistics
Total area of key biodiversity significance
31,801 km² (8.1%)
Number of endangered species
35
| Total | Endangered | |
|---|---|---|
| Mammals | 270 | 9 |
| Breeding Birds | 229 | 14 |
| Reptiles | 180 | 3 |
| Amphibians | 31 | 6 |
| Fish | 122 | 3 |
| Higher Plants | 4,440 | 16 |
Case analysis
Protected area layers
Statistics
Total area under legal protection
108,215 km² (27.7%)
Proportion of key biodiversity areas under legal protection
92.0%
Hover over areas and objects on the map for further data.
Threats to biodiversity layers
Statistics
Number of mines operating or planned in protected areas
6
Number of mines operating or planned within 5km buffer zone of protected areas
11
Number of fires within protected areas in 2014
6,178
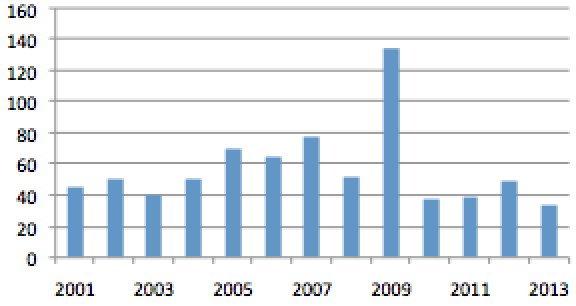
Total forest cover loss within protected areas 2001-2013
749 km²
Forest cover loss within protected areas per year (km²)
 Hover over areas and objects on the map for further data.
Resilience layers
Statistics
Key biodiversity significance area in need of legal protection
2,544 km²
Area of forest gain in protected areas 2002-2012
79 km²
Hover over areas and objects on the map for further data.
Case analysis
Mainstreaming layers
Case analysis
2001200220032004200520062007200820092010201120122013

Forest cover gain (m²)
- 1479.45
- 17757551.80
-
Mining operations
- Bankable
- Closed
- Conceptual
- Construction
- Feasibility
- Operating
- Prefeasibility
- Restart
- Suspended
Population per km² (buffer zones)
- 20.16
- 141.15
-
Population per km² (prot. areas)
- 9.75
- 65.40
-
Fires per km² (prot. areas)
- 0.02
- 0.38
-
Forest cover loss
- Less
- More
Mineral deposits
- Coalfield
- Goldfield
- Great Dyke
Biodiversity & Ecosystem Risk Areas
- Risk Area Coverage
Biodiversity Risks
- A: Fire
- B: Poaching
- C: Alien Invasive Species
- D: Wetland Degradation
Ramsar Sites
- Ramsar Site Coverage
Protected Areas
- Protected Areas Coverage
Key Bio Diversity Areas
- Biodiversity Area Coverage